2022-01-06 by Tao Xu
All top cloud service providers (CSP) have announced 3rd gen Intel® Xeon® CPU (code name Ice Lake-SP). It came with a built-in feature Crypto-NI to accelerate crypto workloads with new AVX512 instructions. Let’s use bcc/bpftrace to analyze its usage in TLS acceleration and see how it works.
1. Background
Crypto workload is very CPU intensive especially public-key RSA (Elliptic-Curve is better). Hardware vendors developed many solutions to offload or accelerate crypto tasks. For example:
- QAT offload device as an add-in PCIe card or integrated in chipset.
- ARMv8 Cryptography Extensions.
- KAE CPU on-die PCIe accelerator.
- FPGA solutions for cloud-based hardware security module (HSM).
A typical use case is SSL/TLS handshake in HTTPS web server, the crypto overhead can be observed by bcc/bpftrace tools, we’ll describe below. Some application may use openssl speed command as a quick method to measure or saturate CPU.
2. CPU hardware
Ice Lake added new AVX512 instructions (plus SHA extension or SHA-NI) for crypto acceleration. Normally application software needs to change to use SIMD intrinsics. Or use the multi-buffer lib which provides batch submission of multiple requests and parallel async processing based on new instruction set.
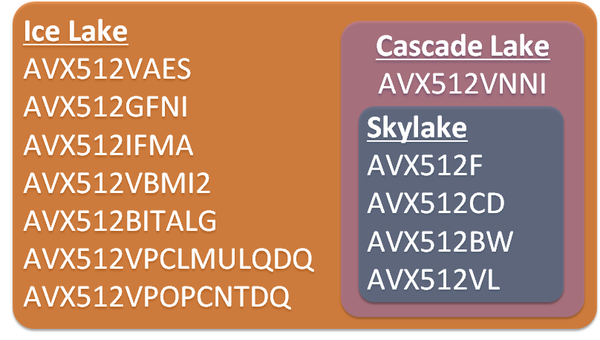
To my best knowledge, next gen CPU (code name Sapphire Rapids or SPR) is planned with Crypto-NI to succeed Ice Lake, so we could expect this built-in crypto acceleration on future Xeon CPU. Furthermore, SPR would provide several types of on-die accelerators including new QAT.
The funny thing is, I’ve also tried on my laptop (using Ubuntu WSL) with Tiger Lake CPU that succeeded Ice Lake/ICL in consumer market, and it works the same as server market Ice Lake/ICX. I guess it’s because they have same microarchitecture features (VAES,GFNI,IFMA,VPCLMULQDQ) though not highlighted in product spec.
3. Software stacks
Ice Lake crypto acceleration is using same software stack as QAT (qat_hw), and called “multi-buffer” (qat_sw) in QAT_Engine. And this extends the usage from dedicated hardware to general available CPU which is great. They also share same use case as already supported in OpenSSL (BoringSSL or BabaSSL), Nginx (Tengine), DPDK Cryptodev, k8s ingress, Istio Envoy, ZFS (QZFS), CDN, etc.
BTW, similar optimization was added in Linux Kernel crypto as well. The patch is in RFC for some time, while kernel crypto algorithm is already using AVX2. Per official document, the Crypto-NI AVX512 is in light power level that improved the downclocking problem. Anyway, here it’s in userland for CPU intensive crypto workload in OpenSSL and TLS handshake.
Ice Lake CPU is officially supported in CentOS/RHEL 8.2 or some Linux developed by CSP. Thanks to previous offload solutions, system default OpenSSL 1.1.1 already support async SSL and engines without changing OpenSSL binary. This is very helpful as changing system OpenSSL has big compatibility issue.
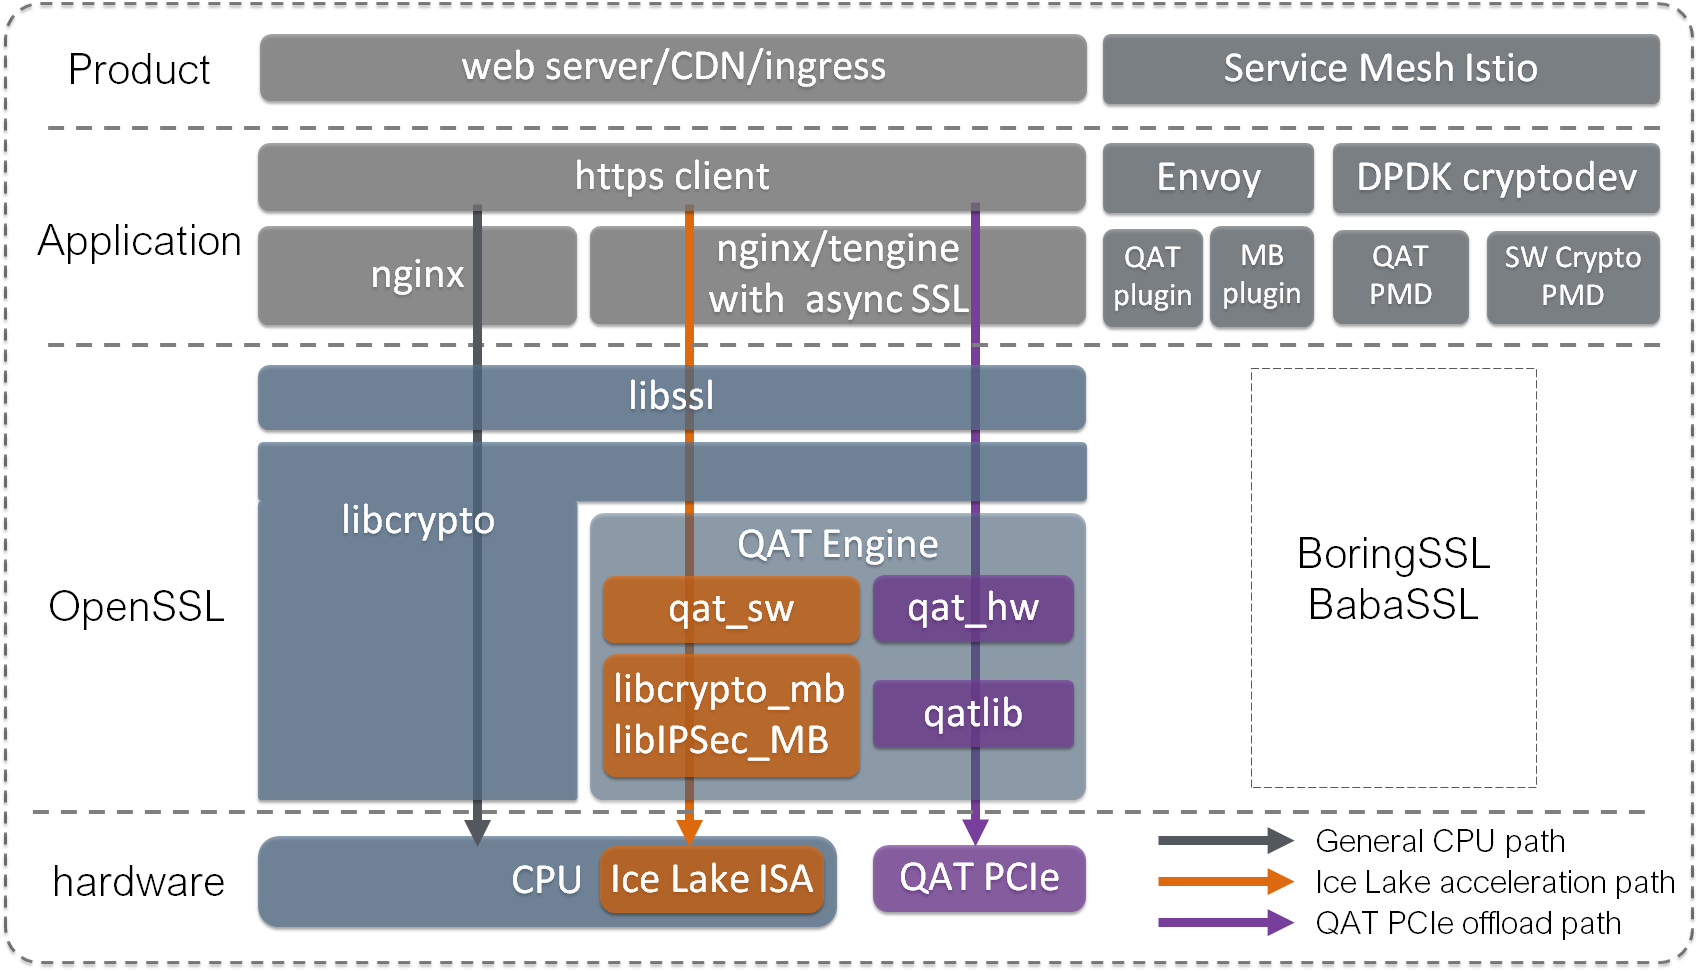
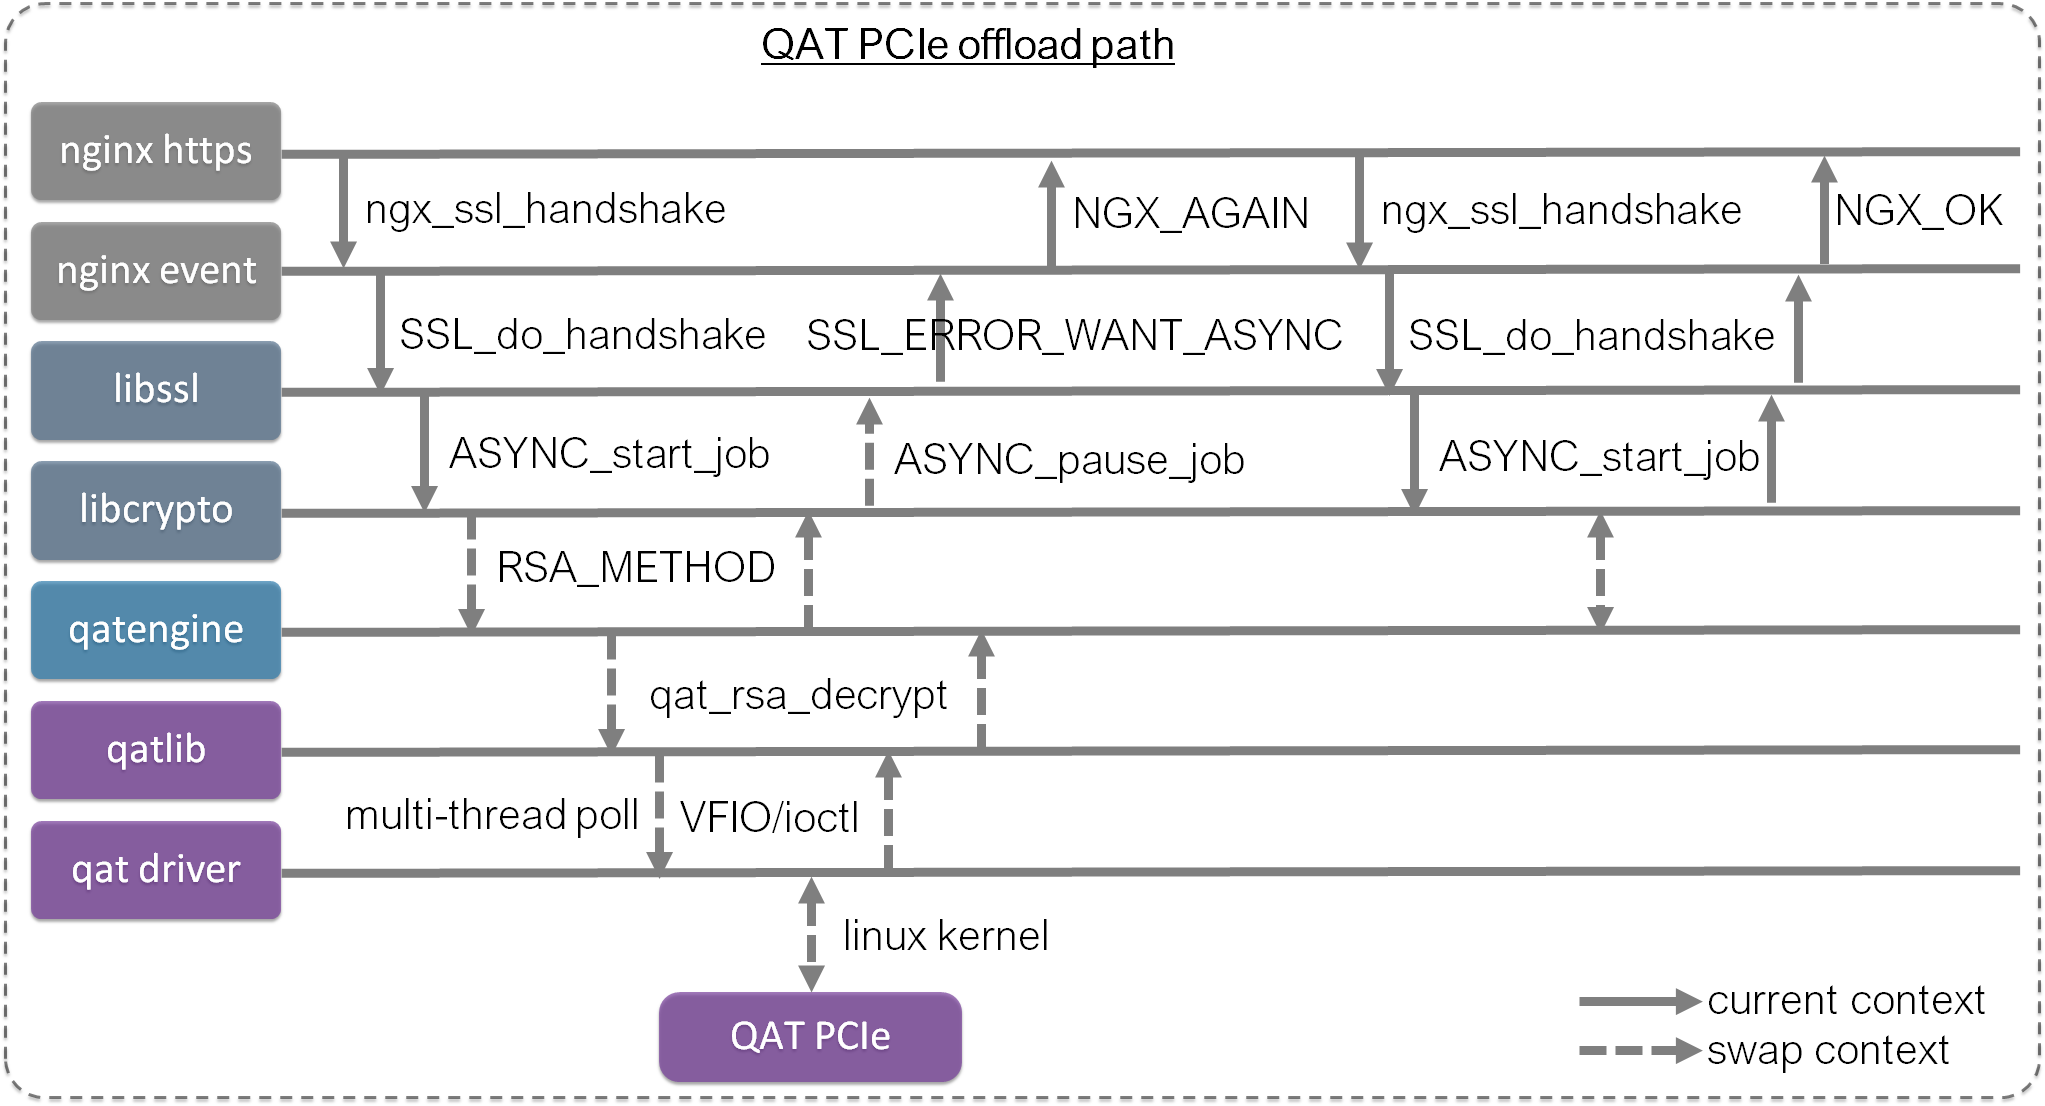
Above shows 3 approaches for HTTPS TLS handshake which will be analyzed below. General CPU path is most common with no special hardware help, it can still benefit from more powerful CPU though. Ice Lake acceleration path is the approach described above using new CPU instructions. QAT offload path is the original TLS offload approach using dedicated hardware.
4. Scenario setup
Refer to the official Crypto-NI doc or this blog (I posted it) in Chinese. Basically, it’s setting up a HTTPS server with Nginx (or Tengine) using Ice Lake acceleration approach described above for TLS acceleration.
Below is using a bear metal instance from one CSP (VM is the same as it’s just using new CPU instructions) to test localhost TLS with no network overhead. It’s also tried with two machines to simulate client-server in private network, result is same as localhost, only need more client machines when using more CPU for HTTPS server. Let’s use localhost to simplify the scenario as a clean reference.
5. bcc/bpftrace analysis
Use the newly added bcc/bpftrace to compare approaches and verify performance gain. Common step is:
- Use
openssl s_clientto issue a single TLS handshake. - Trace handshake functions with
bcc/sslsniffand crypto functions withbpftrace/sslsnoop. - Run wrk stress test referencing nginx doc: open and close for each request with zero bytes to measure SSL/TLS transaction per seconds (TPS).
- Use
bpftrace/ssllatencyto compare the latency distribution for handshake and crypto functions.
# echo | openssl s_client -connect localhost:443
# taskset -c 1 wrk -t 1 -c 1000 -d 10s -H 'Connection: close' https://localhost:443/0kb.bin
a. general CPU approach
This is the default approach and baseline for comparison, TLS performance depends on libcrypto.so from OpenSSL. According to nginx doc: “You can use the openssl speed rsa command to measure how many RSA 2048‑bit signs a single core can sustain per second. As a rough estimate, the number of full SSL handshakes (using ECDHE‑RSA) that a single core can sustain is between 45% and 60% of that value.”
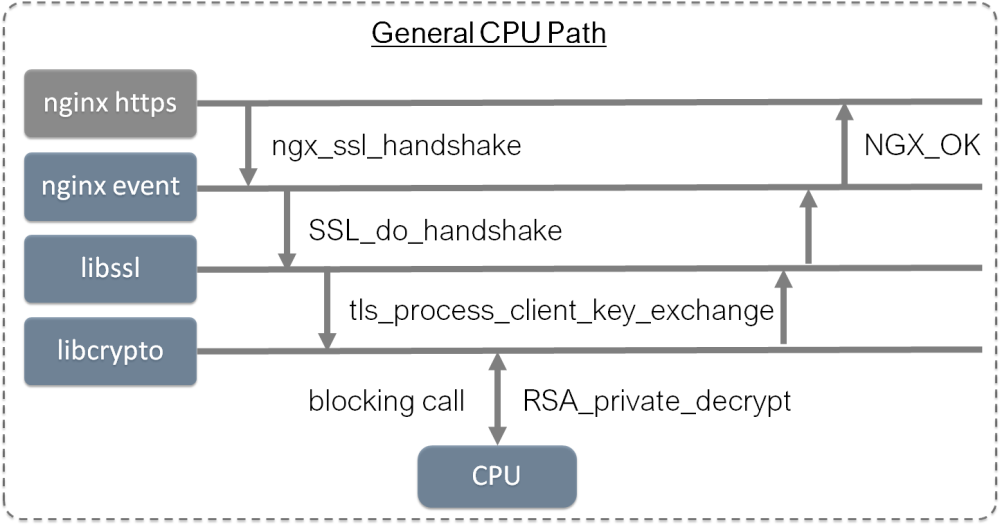
Existing bcc/sslsniff tool can sniff the plaintext and ciphertext in SSL_read/write@libcrypto.so. A verbose option is added to trace additional SSL_do_handshake() before initial SSL_read/write which is the crypto overhead in TLS handshake.
Use openssl s_client to issue a single handshake to nginx server with RSA cipher, SSL_do_handshake() latency is 0.7ms as shown below and it takes 1.3ms before secure connection is ready for SSL_read/write. TLS cipher suite can also change to ECDHE-RSA or ECDHE-ECDSA.
# ./sslsniff.py --hexdump -v
FUNC         TIME(s)            COMM             PID     LEN    LATms
WRITE/SEND   0.000000000        openssl          1265677 0      N/A
HANDSHAKE    0.001296888        nginx            1261684 1      0.687
WRITE/SEND   0.001317746        openssl          1265677 0      1.318
WRITE/SEND   0.001431656        openssl          1265677 1      N/A
----- DATA -----
0a
----- END DATA -----
WRITE/SEND   0.001444130        openssl          1265677 1      0.012
READ/RECV    0.001447699        nginx            1261684 1      0.003
----- DATA -----
0a
----- END DATA -----
A new tool bpftrace/sslsnoop is added for further investigation. Below shows rsa_ossl_private_decrypt()@libcrypto.so takes 0.7ms to complete, and overall handshake takes 1.1ms to get NGX_OK.
# ./sslsnoop.bt
Attaching 60 probes...
Tracing SSL/TLS handshake... Hit Ctrl-C to end.
TIME(us)   TID      COMM     PROBE                          LAT(us)        RET
1921854    1261684  nginx    ngx_ssl_handshake                   84  NGX_AGAIN
1922111    1276282  openssl  rsa_ossl_public_encrypt             39        256
1922801    1261684  nginx    rsa_ossl_private_decrypt           619        256
1922870    1261684  nginx    ngx_ssl_handshake                  700     NGX_OK
^C
Set nginx worker to use one Ice Lake core, and use wrk to saturate the nginx worker, then trace with new tool bpftrace/ssllatency for latency distribution.
Below show two runs with/without the tracing tool. Quote the tools’ man page: “SSL/TLS handshake usually contains network latency and the traced crypto functions are CPU intensive tasks, so call frequency should be low and the overhead of this tool is expected to be negligible.”
# taskset -c 1 wrk -t 1 -c 1000 -d 10s -H 'Connection: close' https://localhost:443/0kb.bin
Running 10s test @ https://localhost:443/0kb.bin
  1 threads and 1000 connections
  Thread Stats   Avg      Stdev     Max   +/- Stdev
    Latency    36.56ms  105.29ms 599.25ms   93.41%
    Req/Sec     1.44k   779.63     8.62k    96.77%
  13465 requests in 10.02s, 3.89MB read
  Non-2xx or 3xx responses: 13465
Requests/sec:   1343.43
Transfer/sec:    397.52KB

# taskset -c 1 wrk -t 1 -c 1000 -d 10s -H 'Connection: close' https://localhost:443/0kb.bin
Running 10s test @ https://localhost:443/0kb.bin
  1 threads and 1000 connections
  Thread Stats   Avg      Stdev     Max   +/- Stdev
    Latency    37.29ms  107.51ms 607.23ms   92.89%
    Req/Sec     1.34k    97.36     1.62k    67.03%
  13257 requests in 10.03s, 3.83MB read
  Non-2xx or 3xx responses: 13257
Requests/sec:   1322.02
Transfer/sec:    391.18KB
Below is the tracing output of ssllatency for the 2nd run. wrk run 10s with 13257 requests, ssllatency traced 13289 successful handshake calls returned NGX_OK and 14257 returned NGX_AGAIN. Average latency of rsa_ossl_private_decrypt() and successful ngx_ssl_handshake() are the same 0.7ms as in sslsnoop.
# ./ssllatency.bt
Attaching 59 probes...
Tracing SSL/TLS handshake in us... Hit Ctrl-C to end.
^C
@hist[ngx_ssl_handshake]:
[600, 800)         12870 |@@@@@@@@@@@@@@@@@@@@@@@@@@@@@@@@@@@@@@@@@@@@@@@@@@@@|
[800, 1000)          136 |                                                    |
[1000, ...)          283 |@                                                   |

@hist[rsa_ossl_private_decrypt]:
[600, 800)         12870 |@@@@@@@@@@@@@@@@@@@@@@@@@@@@@@@@@@@@@@@@@@@@@@@@@@@@|
[800, 1000)          419 |@                                                   |

@histF[ngx_ssl_handshake]:
[0, 200)           14255 |@@@@@@@@@@@@@@@@@@@@@@@@@@@@@@@@@@@@@@@@@@@@@@@@@@@@|
[200, 400)             0 |                                                    |
[400, 600)             0 |                                                    |
[600, 800)             0 |                                                    |
[800, 1000)            0 |                                                    |
[1000, ...)            2 |                                                    |

@stat[rsa_ossl_private_decrypt]: count 13289, average 631, total 8395839
@stat[ngx_ssl_handshake]: count 13289, average 690, total 9180173
@statF[ngx_ssl_handshake]: count 14257, average 27, total 390248
We can now confirm the libcrypto.so bottleneck: one Ice Lake core can perform roughly ~1400 (1s/0.7ms) blocking rsa_ossl_private_decrypt() calls at most per second and we’re getting 1322/s of wrk HTTPS RPS.
Actually use 1 thread with 10 connections in wrk client is enough to saturate one Ice Lake core used by nginx worker. Use 1000 connections here for same workload as in CPU accelerated approach.
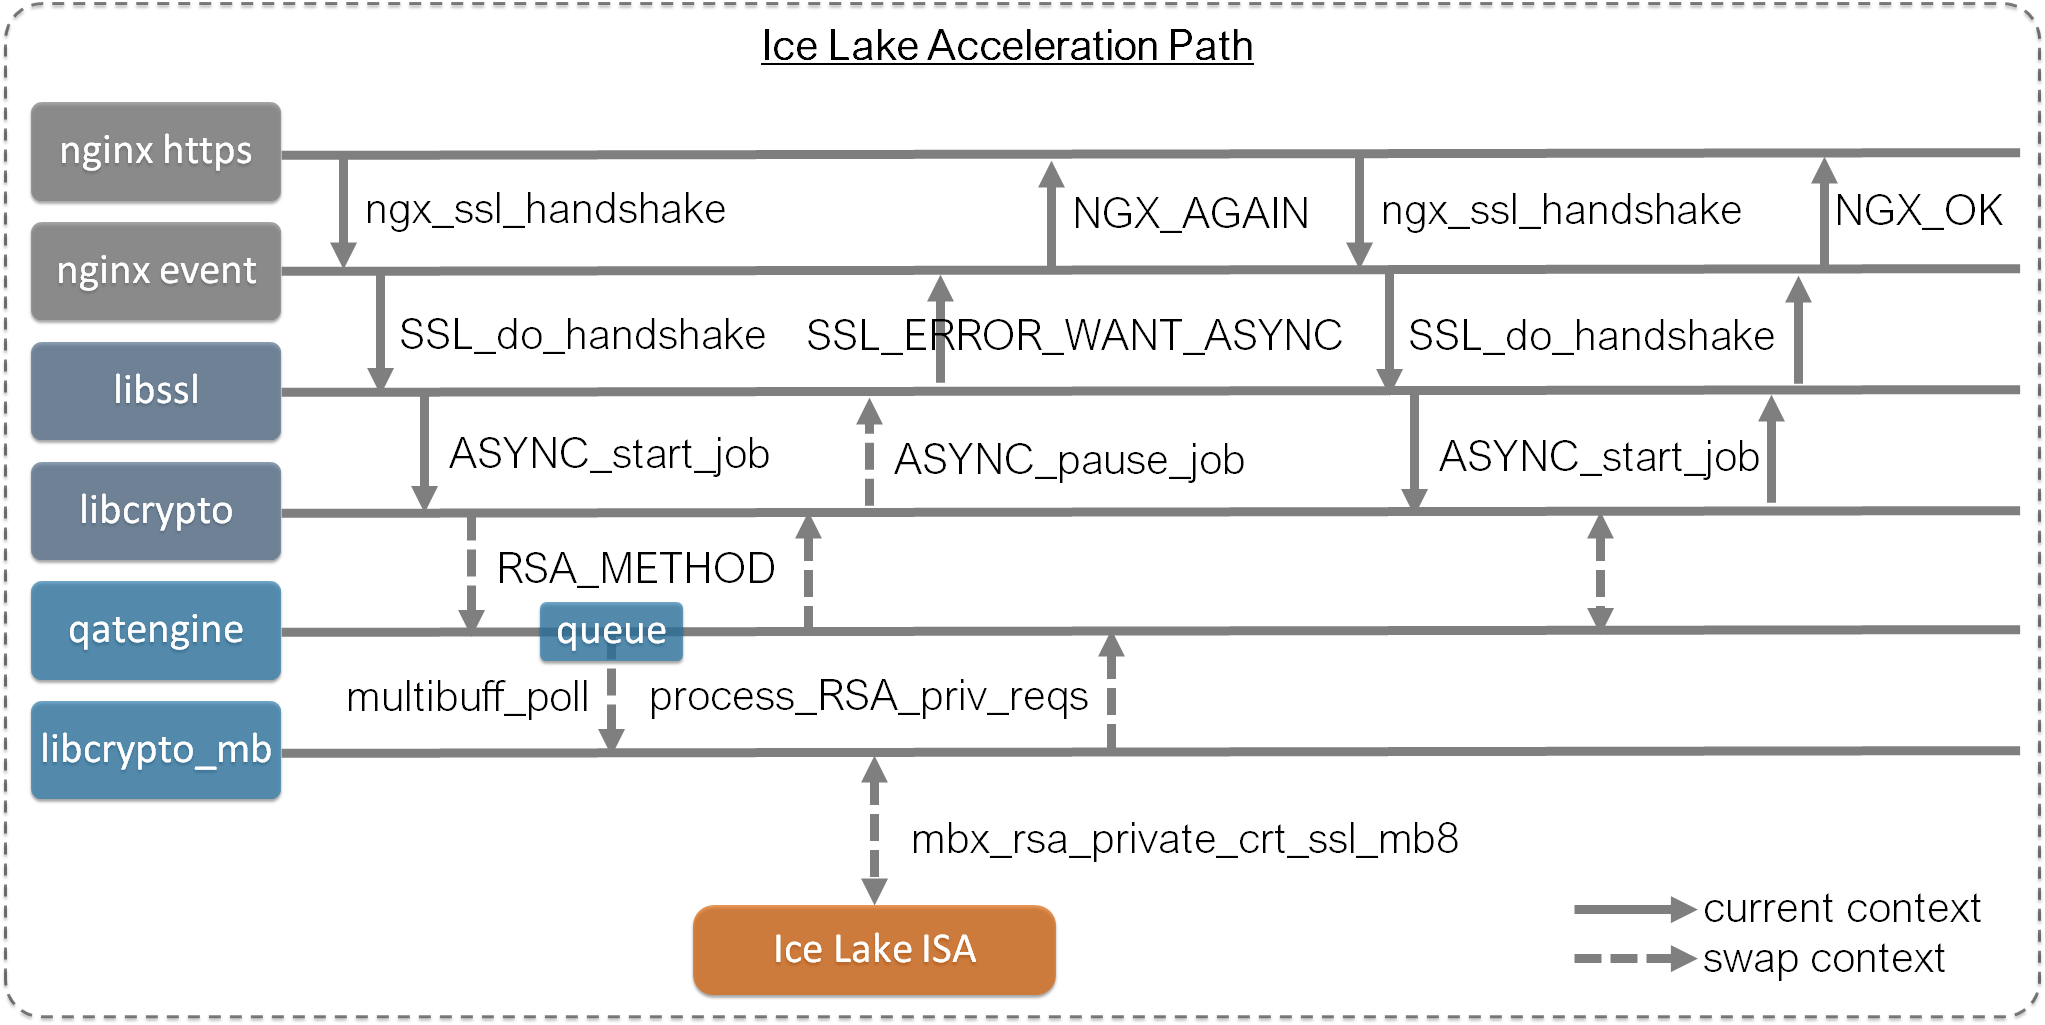
b. Ice Lake acceleration approach
This is the CPU acceleration approach by using async SSL and qatengine in OpenSSL, originally designed for QAT offload, to accelerate those CPU intensive crypto tasks in TLS handshake. Use multi-buffer (MB) style functions in libcrypto_mb.so to take advantage of new AVX512 on Ice Lake.
Same as the steps in baseline sync approach, use bcc/sslsniff first to trace single handshake, and then use bpftrace/sslsnoop to break down the latency, and finally use bpftrace/ssllatency to compare the statistical summary in wrk benchmark.
SSL_do_handshake() is now faster to collect NGX_OK state without blocking call to crypto functions. But overall it takes 2.5ms before SSL_read/write which is slower than default 1.3ms baseline. It’s somehow expected as deeper async stack has certain overhead than sync call and performance gain will normally be shown with batch async requests. It’s how async generally works for better throughput but can harm latency.
# ./sslsniff.py --hexdump -v
FUNC         TIME(s)            COMM             PID     LEN    LATms
WRITE/SEND   0.000000000        openssl          1396141 0      N/A
HANDSHAKE    0.002518047        nginx            1366117 1      0.084
WRITE/SEND   0.002537873        openssl          1396141 0      2.538
WRITE/SEND   0.002642700        openssl          1396141 1      N/A
----- DATA -----
0a
----- END DATA -----
WRITE/SEND   0.002653655        openssl          1396141 1      0.011
READ/RECV    0.002657928        nginx            1366117 1      0.004
----- DATA -----
0a
----- END DATA -----
Investigate further below, there’s one more NGX_AGAIN transaction than baseline sync approach, then nginx created another async thread (note the different TID) to process the crypto request using MB style functions in libcrypto_mb.so, and finally collect the result.
# ./sslsnoop.bt
Attaching 60 probes...
Tracing SSL/TLS handshake... Hit Ctrl-C to end.
TIME(us)   TID      COMM     PROBE                          LAT(us)        RET
1522984    1366117  nginx    ngx_ssl_handshake                   80  NGX_AGAIN
1523280    1404482  openssl  rsa_ossl_public_encrypt             46        256
1523363    1366117  nginx    ngx_ssl_handshake                   20  NGX_AGAIN
1534433    1366118  nginx    mbx_rsa_private_crt_ssl_mb8       1004       void
1534486    1366118  nginx    mbx_rsa_public_ssl_mb8              45       void
1534494    1366118  nginx    process_RSA_priv_reqs             1070       void
1534595    1366117  nginx    ngx_ssl_handshake                   97     NGX_OK
^C
Before going to wrk benchmark, let’s try to optimize the single handshake case. Thread creation can be slow and non-deterministic due to Linux sched. Above timestamp shows 11ms between 1366117 and 1366118 including the 1ms MB function latency. There’s a heuristic polling scheme, also described in this QTLS paper, that can avoid the thread creation. Heuristic polling reduced the overall time from 2.5ms to 1.7ms:
# ./sslsniff.py --hexdump -v
FUNC         TIME(s)            COMM             PID     LEN    LATms
WRITE/SEND   0.000000000        openssl          1423517 0      N/A
HANDSHAKE    0.001694604        nginx            1423095 1      0.072
WRITE/SEND   0.001711605        openssl          1423517 0      1.712
WRITE/SEND   0.001814036        openssl          1423517 1      N/A
----- DATA -----
0a
----- END DATA -----
WRITE/SEND   0.001824460        openssl          1423517 1      0.010
READ/RECV    0.001830783        nginx            1423095 1      0.005
----- DATA -----
0a
----- END DATA -----
We can see from below output the libcrypto_mb.so calculation is done in the extra NGX_AGAIN routine without involving new thread. And the overall handshake latency is reduced and more stable.
# ./sslsnoop.bt
Attaching 60 probes...
Tracing SSL/TLS handshake... Hit Ctrl-C to end.
TIME(us)   TID      COMM     PROBE                          LAT(us)        RET
1271355    1423095  nginx    ngx_ssl_handshake                   58  NGX_AGAIN
1271605    1423296  openssl  rsa_ossl_public_encrypt             40        256
1272683    1423095  nginx    mbx_rsa_private_crt_ssl_mb8        992       void
1272733    1423095  nginx    mbx_rsa_public_ssl_mb8              46       void
1272737    1423095  nginx    process_RSA_priv_reqs             1050       void
1272739    1423095  nginx    multibuff_poll                    1059       void
1272741    1423095  nginx    ngx_ssl_handshake                 1072  NGX_AGAIN
1272811    1423095  nginx    ngx_ssl_handshake                   68     NGX_OK
^C
If new thread, it can run on another CPU core without careful affinity setting. So using same number of nginx worker process may result in double CPU consumption. Heuristic polling is preferred for better and stable latency, and strict comparison under same CPU consumption.
Run wrk benchmark twice again to verify tracing tool overhead. The ssllatency overhead increased a bit compared to baseline as performance is better (higher call frequency), and still acceptable (5%). TLS TPS is ~4000/s per core, 3x better than ~1300/s baseline. Latency is also better because the same workload is already overloaded for baseline sync approach.
# taskset -c 1 wrk -t 1 -c 1000 -d 10s -H 'Connection: close' https://localhost:443/0kb.bin
Running 10s test @ https://localhost:443/0kb.bin
  1 threads and 1000 connections
  Thread Stats   Avg      Stdev     Max   +/- Stdev
    Latency    16.02ms   12.00ms  87.37ms   77.90%
    Req/Sec     4.22k   848.83     6.12k    67.02%
  41780 requests in 10.09s, 12.07MB read
  Non-2xx or 3xx responses: 41780
Requests/sec:   4140.90
Transfer/sec:      1.20MB

# taskset -c 1 wrk -t 1 -c 1000 -d 10s -H 'Connection: close' https://localhost:443/0kb.bin
Running 10s test @ https://localhost:443/0kb.bin
  1 threads and 1000 connections
  Thread Stats   Avg      Stdev     Max   +/- Stdev
    Latency    13.78ms   11.57ms  90.25ms   87.56%
    Req/Sec     4.02k     0.86k    8.87k    80.00%
  39727 requests in 10.08s, 11.48MB read
  Non-2xx or 3xx responses: 39727
Requests/sec:   3941.74
Transfer/sec:      1.14MB
Look at the tracing output below for the 2nd run, and compare with the baseline sync approach.
# ./ssllatency.bt
Attaching 59 probes...
Tracing SSL/TLS handshake in us... Hit Ctrl-C to end.
^C
@hist[process_RSA_priv_reqs]:
[800, 1000)         3587 |@@@@@@@@@@@@@@@@@@@@@@@@@@@@@@@@@@@@@@@@@@@@@@@@@@@@|
[1000, ...)         1417 |@@@@@@@@@@@@@@@@@@@@                                |

@hist[mbx_rsa_private_crt_ssl_mb8]:
[800, 1000)         4486 |@@@@@@@@@@@@@@@@@@@@@@@@@@@@@@@@@@@@@@@@@@@@@@@@@@@@|
[1000, ...)          518 |@@@@@@                                              |

@hist[mbx_rsa_public_ssl_mb8]:
[0, 200)            5004 |@@@@@@@@@@@@@@@@@@@@@@@@@@@@@@@@@@@@@@@@@@@@@@@@@@@@|

@hist[multibuff_poll]:
[0, 200)            2165 |@@@@@@@@@@@@@@@@@@@@@@@@@@@@@@@@                    |
[200, 400)             0 |                                                    |
[400, 600)             0 |                                                    |
[600, 800)             0 |                                                    |
[800, 1000)         3422 |@@@@@@@@@@@@@@@@@@@@@@@@@@@@@@@@@@@@@@@@@@@@@@@@@@@@|
[1000, ...)         1582 |@@@@@@@@@@@@@@@@@@@@@@@@                            |

@hist[ngx_ssl_handshake]:
[0, 200)           39753 |@@@@@@@@@@@@@@@@@@@@@@@@@@@@@@@@@@@@@@@@@@@@@@@@@@@@|
[200, 400)             9 |                                                    |
[400, 600)             2 |                                                    |

@histF[ngx_ssl_handshake]:
[0, 200)           75508 |@@@@@@@@@@@@@@@@@@@@@@@@@@@@@@@@@@@@@@@@@@@@@@@@@@@@|
[200, 400)            42 |                                                    |
[400, 600)            32 |                                                    |
[600, 800)             8 |                                                    |
[800, 1000)            3 |                                                    |
[1000, ...)         4932 |@@@                                                 |

@stat[mbx_rsa_public_ssl_mb8]: count 5004, average 40, total 204391
@stat[ngx_ssl_handshake]: count 39764, average 50, total 1996767
@stat[multibuff_poll]: count 7169, average 710, total 5092790
@stat[mbx_rsa_private_crt_ssl_mb8]: count 5004, average 962, total 4817354
@stat[process_RSA_priv_reqs]: count 5004, average 1013, total 5071608
@statF[ngx_ssl_handshake]: count 80525, average 79, total 6436227
wrk run 10s with 39727 requests, ssllatency traced 39764 handshake calls returned NGX_OK and 80525 returned NGX_AGAIN. The NGX_AGAIN calls are doubled as expected from async routines. All the NGX_OK calls returned very quickly averaging 50us’ latency. And among all the NGX_AGAIN calls (shown in histF above), ~5k took >1ms to complete while others returned very quickly. The 5k NGX_AGAIN calls are those triggered by heuristic polling to process multi-buffer requests using AVX512 in one go.
Average latency of process_RSA_priv_reqs() and MB style RSA functions in libcrypto_mb.so are the same 1ms as in sslsnoop. But the number of calls is no longer 1-to-1 equal to TLS handshake requests, it’s just 1/8 (5k/40k) of them. This is the key benefit from async and batch process by AVX512. The buffer queue size is currently hardcoded at 8 and the function name suffix mb8 already tells us.
This is a good example for bcc/bpftrace in-kernel processing which is extremely helpful with histograms and statistical summary. We can also use sslsnoop to trace during the wrk benchmark, and see how NGX_OK are returned in batch. Note the event timestamp may not show in order as thread local data are not synced, post process it if needed. The text output will be huge, so it’s more convenient to just use ssllatency.
c. QAT offload approach
This is the original SSL offload approach from 1st gen QAT on Skylake. I can’t find machine with QAT hardware, so will skip the data analysis here (official perf data reference).
It’s sharing same upper layer with Ice Lake multi-buffer approach, so bcc/bpftrace tools can also be useful. More overhead is expected as it needs in-kernel PCIe driver with extra CPU memory resource for ioctl and polling. As dedicated hardware (yet to be on-die on SPR), there’s PCIe bandwidth limit and it needs maintenance like fallback to CPU approach back and forth. While QAT can co-exist with built-in AVX512 acceleration, it’s maybe more useful on IPU with limited processor or CPU compression offload like in QZFS.
Thanks to previous QAT offload solutions (again), OpenSSL added support in 1.1.0 version. And nginx fork tengine already support async SSL long ago, it’s running in many products for years. Note the nginx we tested above is asynch_mode_nginx developed by intel.
6. Performance results
Use same bear metal instance as in above tracing for multi-core data. Ice Lake instance is 2x Xeon 8369B with 64 cores or 128 threads, and Cascade Lake instance is 2x Xeon 8269CY with 52 cores or 104 threads. As crypto workload is CPU intensive, using HyperThread (HT) or not is the same for raw crypto performance.
a. OpenSSL
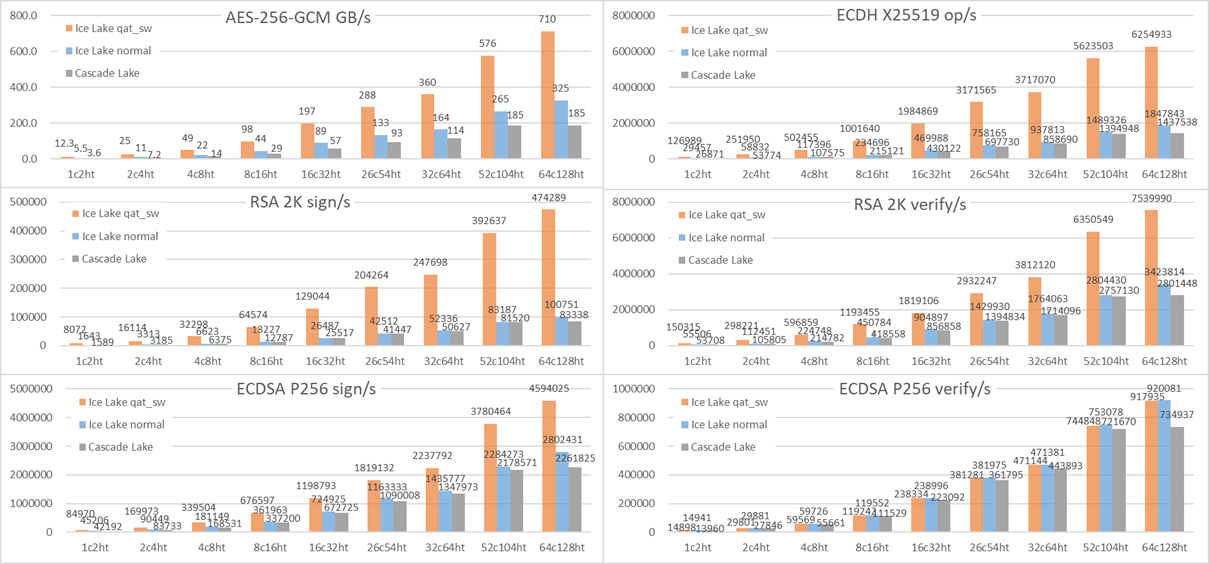
Comparing raw crypto algorithm performance by using openssl speed command.
# openssl speed -multi [1-N] -evp [aes-256-gcm]
# openssl speed -multi [1-N] -engine qatengine -evp [aes-256-gcm]
# openssl speed -multi [1-N] [rsa2048|ecdhx25519|ecdsap256]
# openssl speed -multi [1-N] -engine qatengine -async_jobs 8 [rsa2048|ecdhx25519|ecdsap256]
Below is a raw crypto performance comparison. Take AES-256 as an example: no acceleration Ice Lake is 50% better per core than Cascade Lake, and system-wide Ice Lake is 70% better as it has more cores. Accelerated Ice Lake is 3x better (3.4x per core ~ 3.8x system-wide) with software-hardware collaboration.
For public-key RSA and EC, no acceleration Ice Lake is almost same as Cascade Lake. With Ice Lake crypto acceleration, RSA and EC can be 2x~5x better. We can also observe the RSA sign/s bottleneck, just switch to ECDSA can be more than 10x better without hardware change.
b. Nginx/Tengine
Below is the comparison in typical user application TLS handshake: Nginx (asynch_mode_nginx v0.4.6) on the left, Tengine (v2.3.3) on the right, results are close. As mentioned early, simplify the scenario by using localhost, bind nginx/tengine on one CPU socket, and use the other for wrk client. TLS cipher suite is AES256-GCM-SHA384, ECDHE-RSA-AES256-GCM-SHA384, ECDHE-ECDSA-AES256-GCM-SHA384.
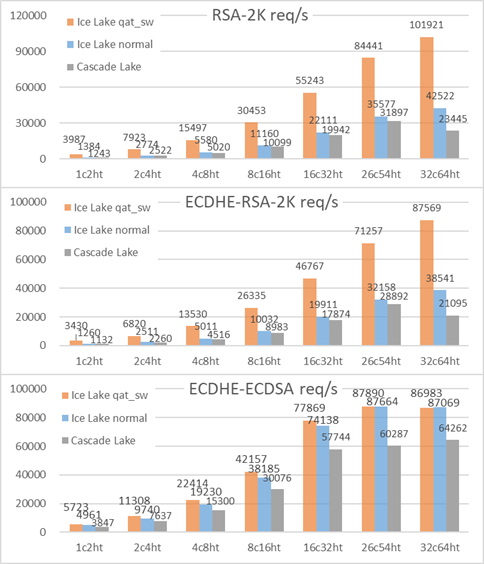
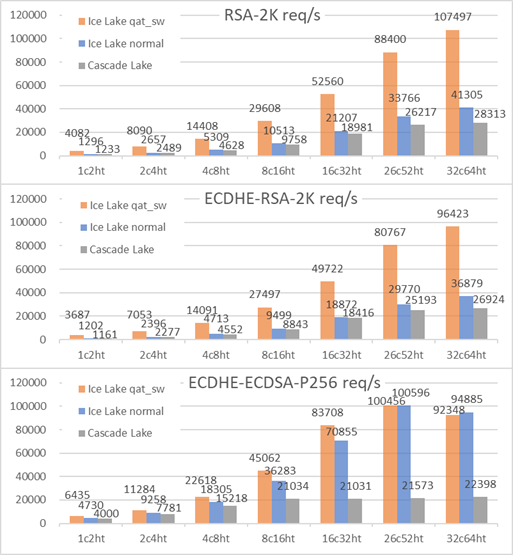
For RSA based TLS, no acceleration Ice Lake is almost same as Cascade Lake with ~10% per core improvement. And accelerated Ice Lake gets 3x better. This makes sense as RSA is generally the bottleneck. Nginx doc mentioned 45%~60% correlation ratio between raw openssl RSA speed and TLS handshake performance, it’s based on empirical data on older CPU. bcc/bpftrace tool showed libcrypto.so RSA takes 0.7ms in the total 1.1ms handshake time. By async accelerating RSA, per core TLS performance improved 3x times.
For ECDSA based TLS, ECDSA algorithm along is a huge optimization to replace RSA, more than 10x better as measured above in openssl raw speed test, then crypto task is no longer a bottleneck and rest part in TLS handshake becomes more significant. Ice Lake acceleration is now less obvious (~30%) which is also consistent with official QAT perf data reference. Even wrk client is not enough when using more CPU cores for HTTPS server. The overall result is reasonable.
Summary
Crypto workload is CPU intensive especially RSA and generally a bottleneck in HTTPS server. Ice Lake added new AVX512 instructions for crypto acceleration and shares same software stack (use case) as previous offload solution for dedicated hardware.
By using new bcc/bpftrace tools, async SSL software stack is analyzed with latency breakdown and statistical summary. RSA based TLS is verified to be 3x better per core by using Ice Lake crypto acceleration on HTTPS server. And ECDSA based TLS has less obvious optimization at ~30% as crypto task is no longer the bottleneck.